Tesla (TSLA) Approaches Critical Golden Ratio Support Level: Will a Bullish Reversal Follow?
Overview
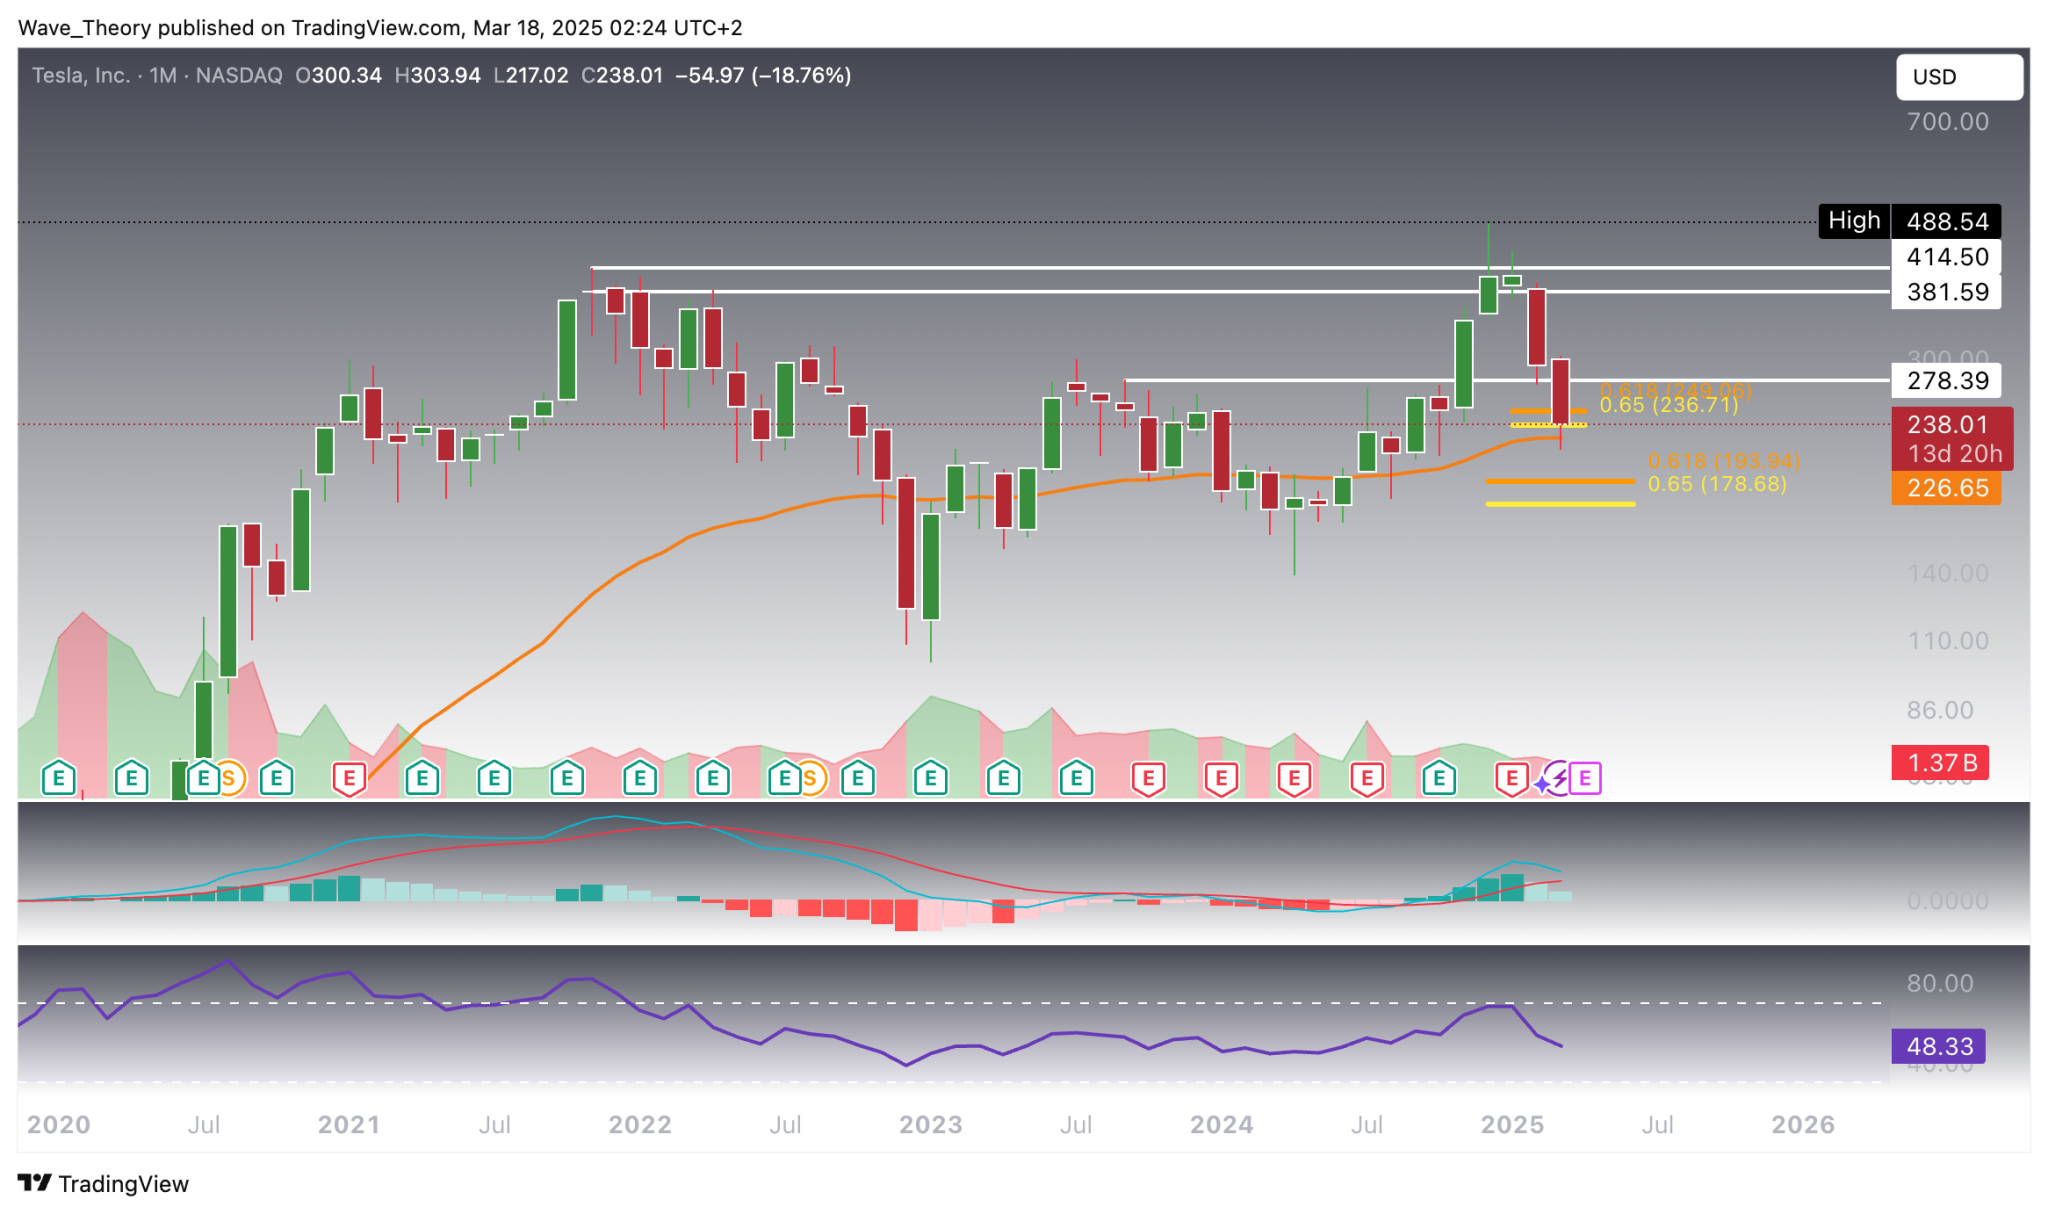
Tesla stock has reached the critical golden ratio support level, potentially being a trigger for a bullish reversal. Since its all-time high in December 2024, Tesla’s stock dropped by a staggering 55.6% as it faced significant resistance levels between $381.6 and $414.5. However, the stock has now retraced to the pivotal 50-month EMA at the golden ratio level of $226, which could be a game-changer for investors.
Key Points
- Current support level at $226 aligns with the 50-month EMA.
- Bearish signals such as a ticking lower MACD histogram imply weakening momentum.
- The MACD lines have crossed bearishly, yet the RSI remains neutral, creating ambiguity.
Tesla’s Inflection Point
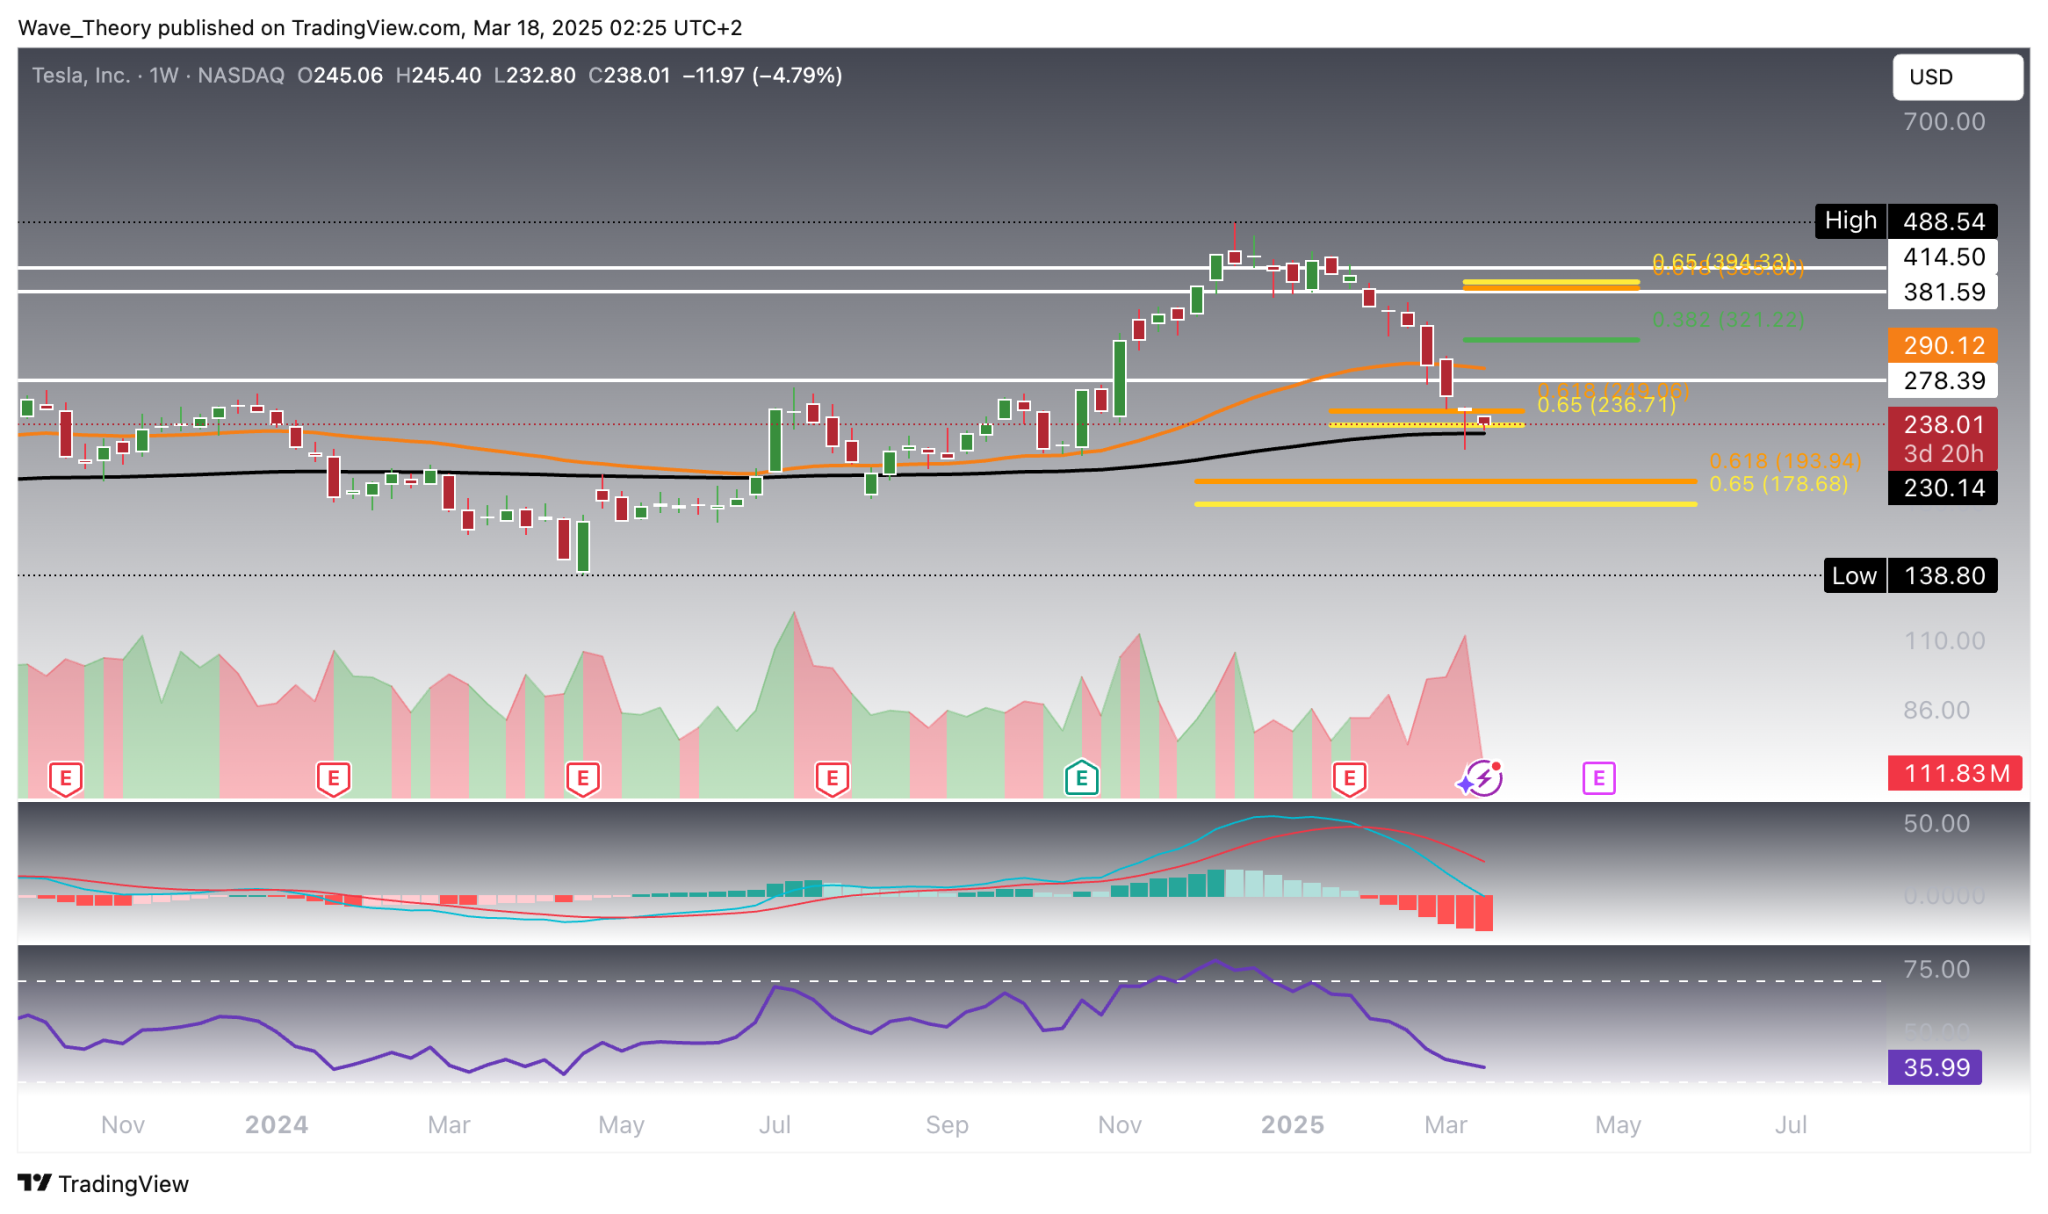
Failing to hold the $226 level may lead to further declines towards the next golden ratio support at $180. The weekly indicators predominantly suggest bearish trends with the MACD lines crossing bearishly and the histogram declining. However, the RSI is still neutral and the EMAs show a golden crossover—this indicates a maintained bullish trend mid-term.
If a rebound occurs, expect Tesla to rally up to new Fibonacci resistance points at $321, and $390. A breakout above $390 might terminate the current corrective phase, signaling Tesla’s return to a bullish trajectory.
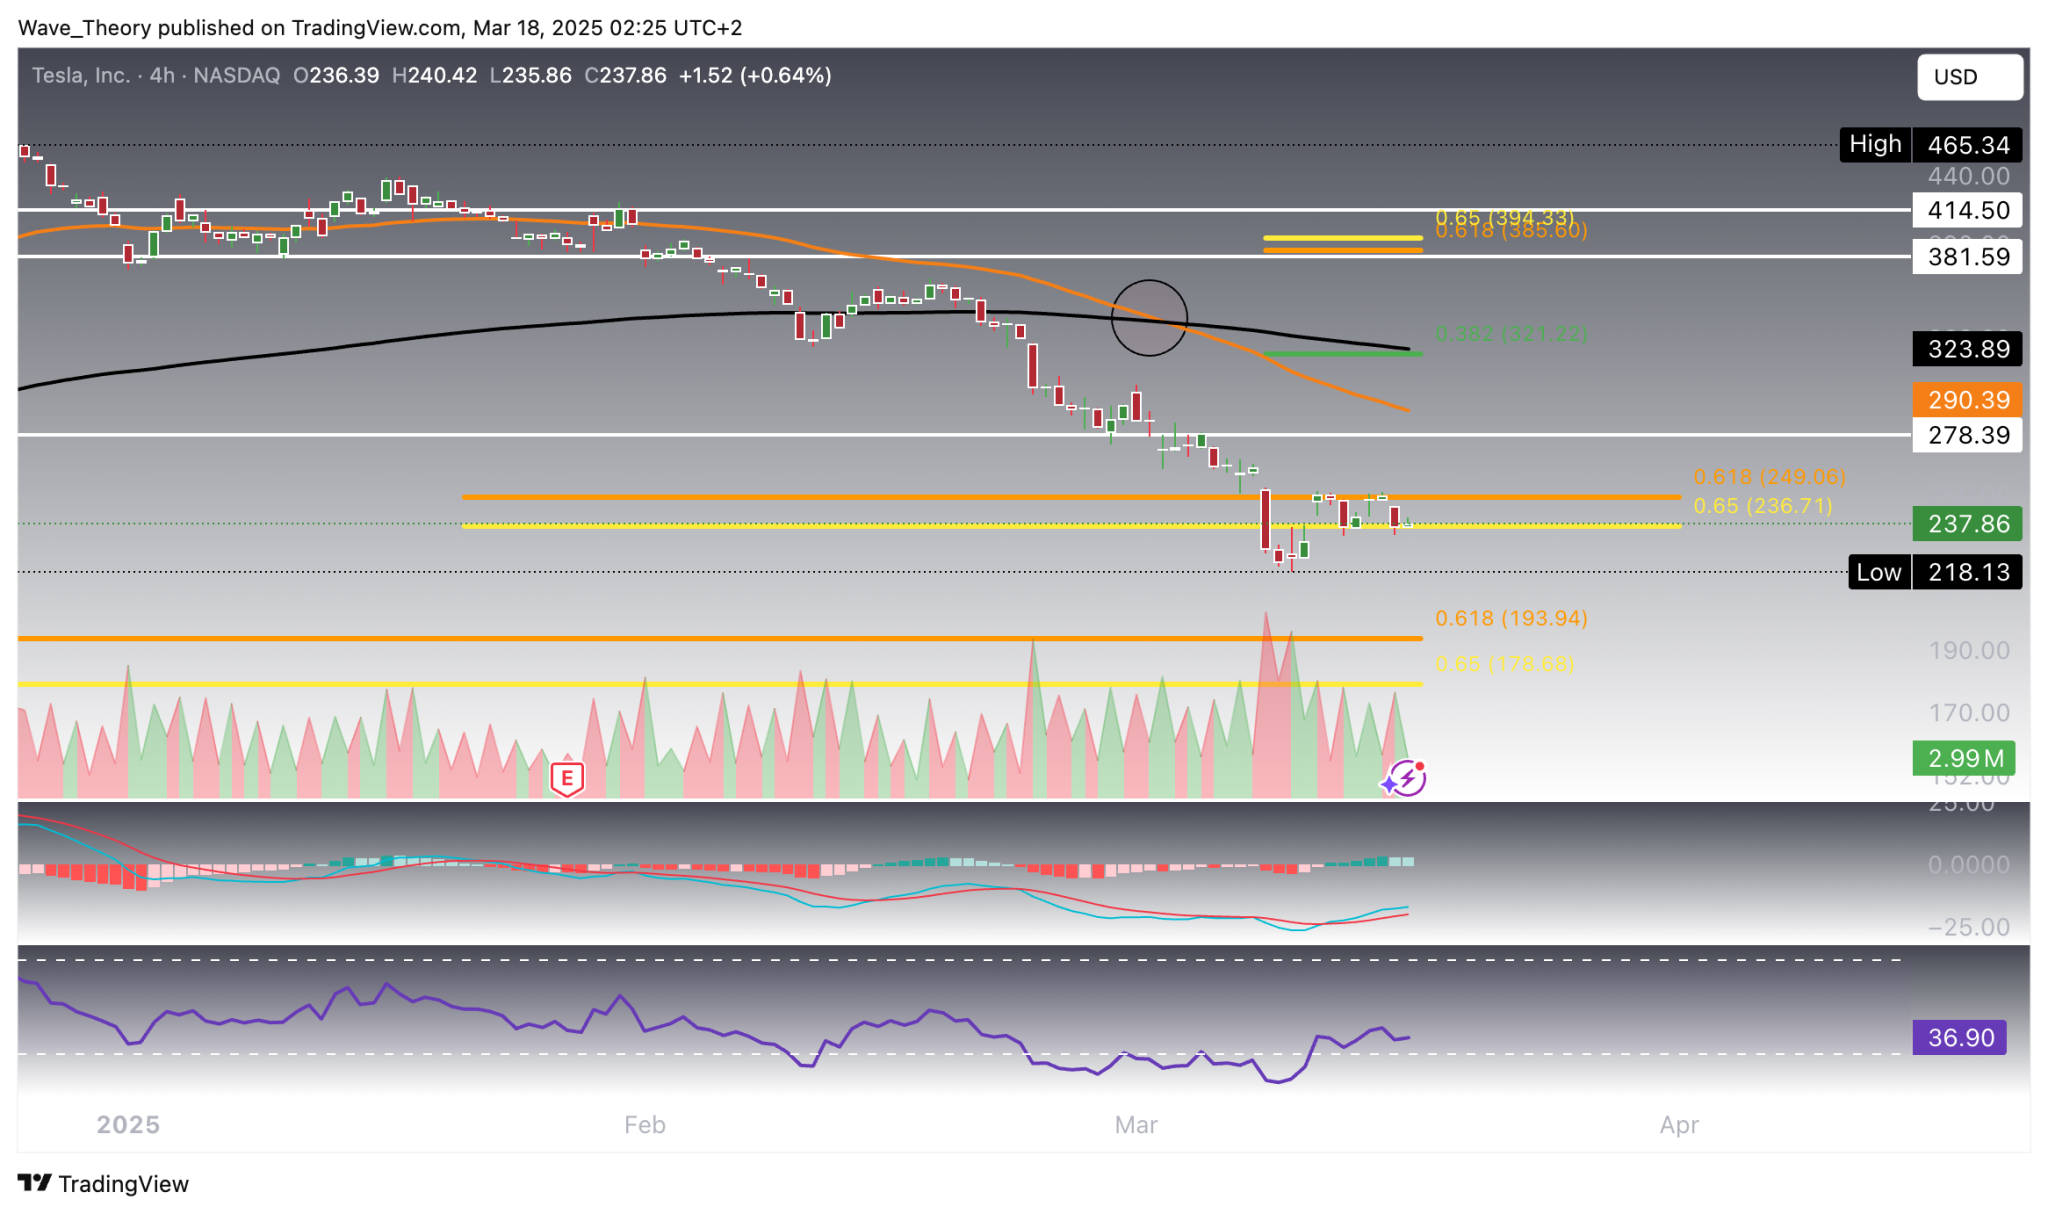
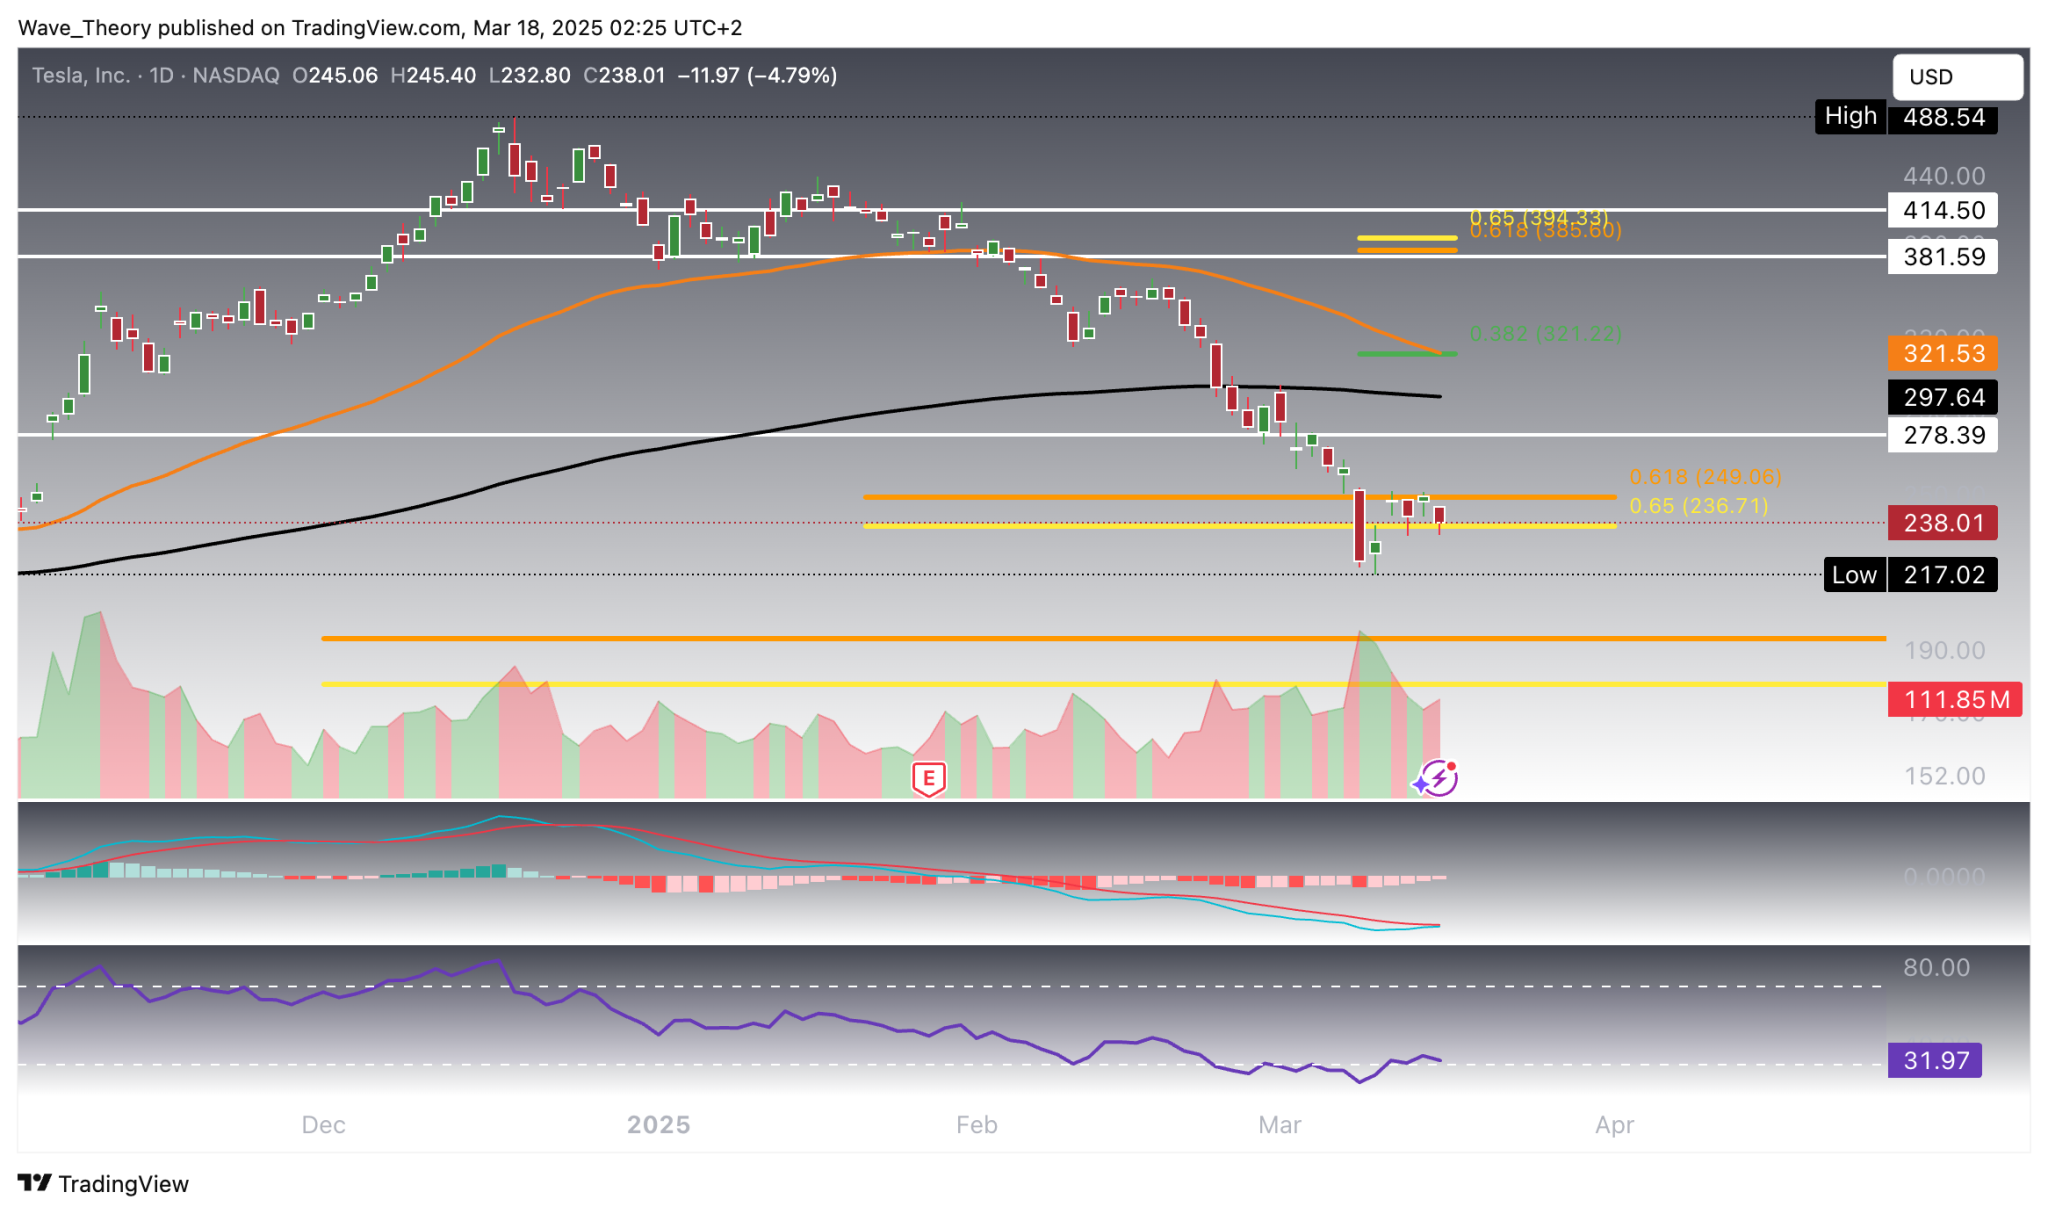
Mixed Signals on the Daily Chart
Tesla’s current position on the daily chart could lead to a ‘death cross’ — where the 50-day EMA crosses below the 200-day EMA, indicating a bearish short- to medium-term trend. Contrastingly, the MACD suggests potential upward momentum, with MACD lines near a bullish crossover and the histogram ticking higher. Still, the RSI remains neutral, adding uncertainty to Tesla’s short-term trajectory.
Conclusion & Opinion
The market presents mixed signals, but the golden ratio support level marks a crucial point for traders. Whether TSLA rebounds from this line or faces further declines will heavily impact upcoming trading strategies. Keeping a watchful eye on the RSI and MACD indicators will provide insight on upcoming movements.