
S&P 500 Approaches Key Support Levels: Bounce or Correction?
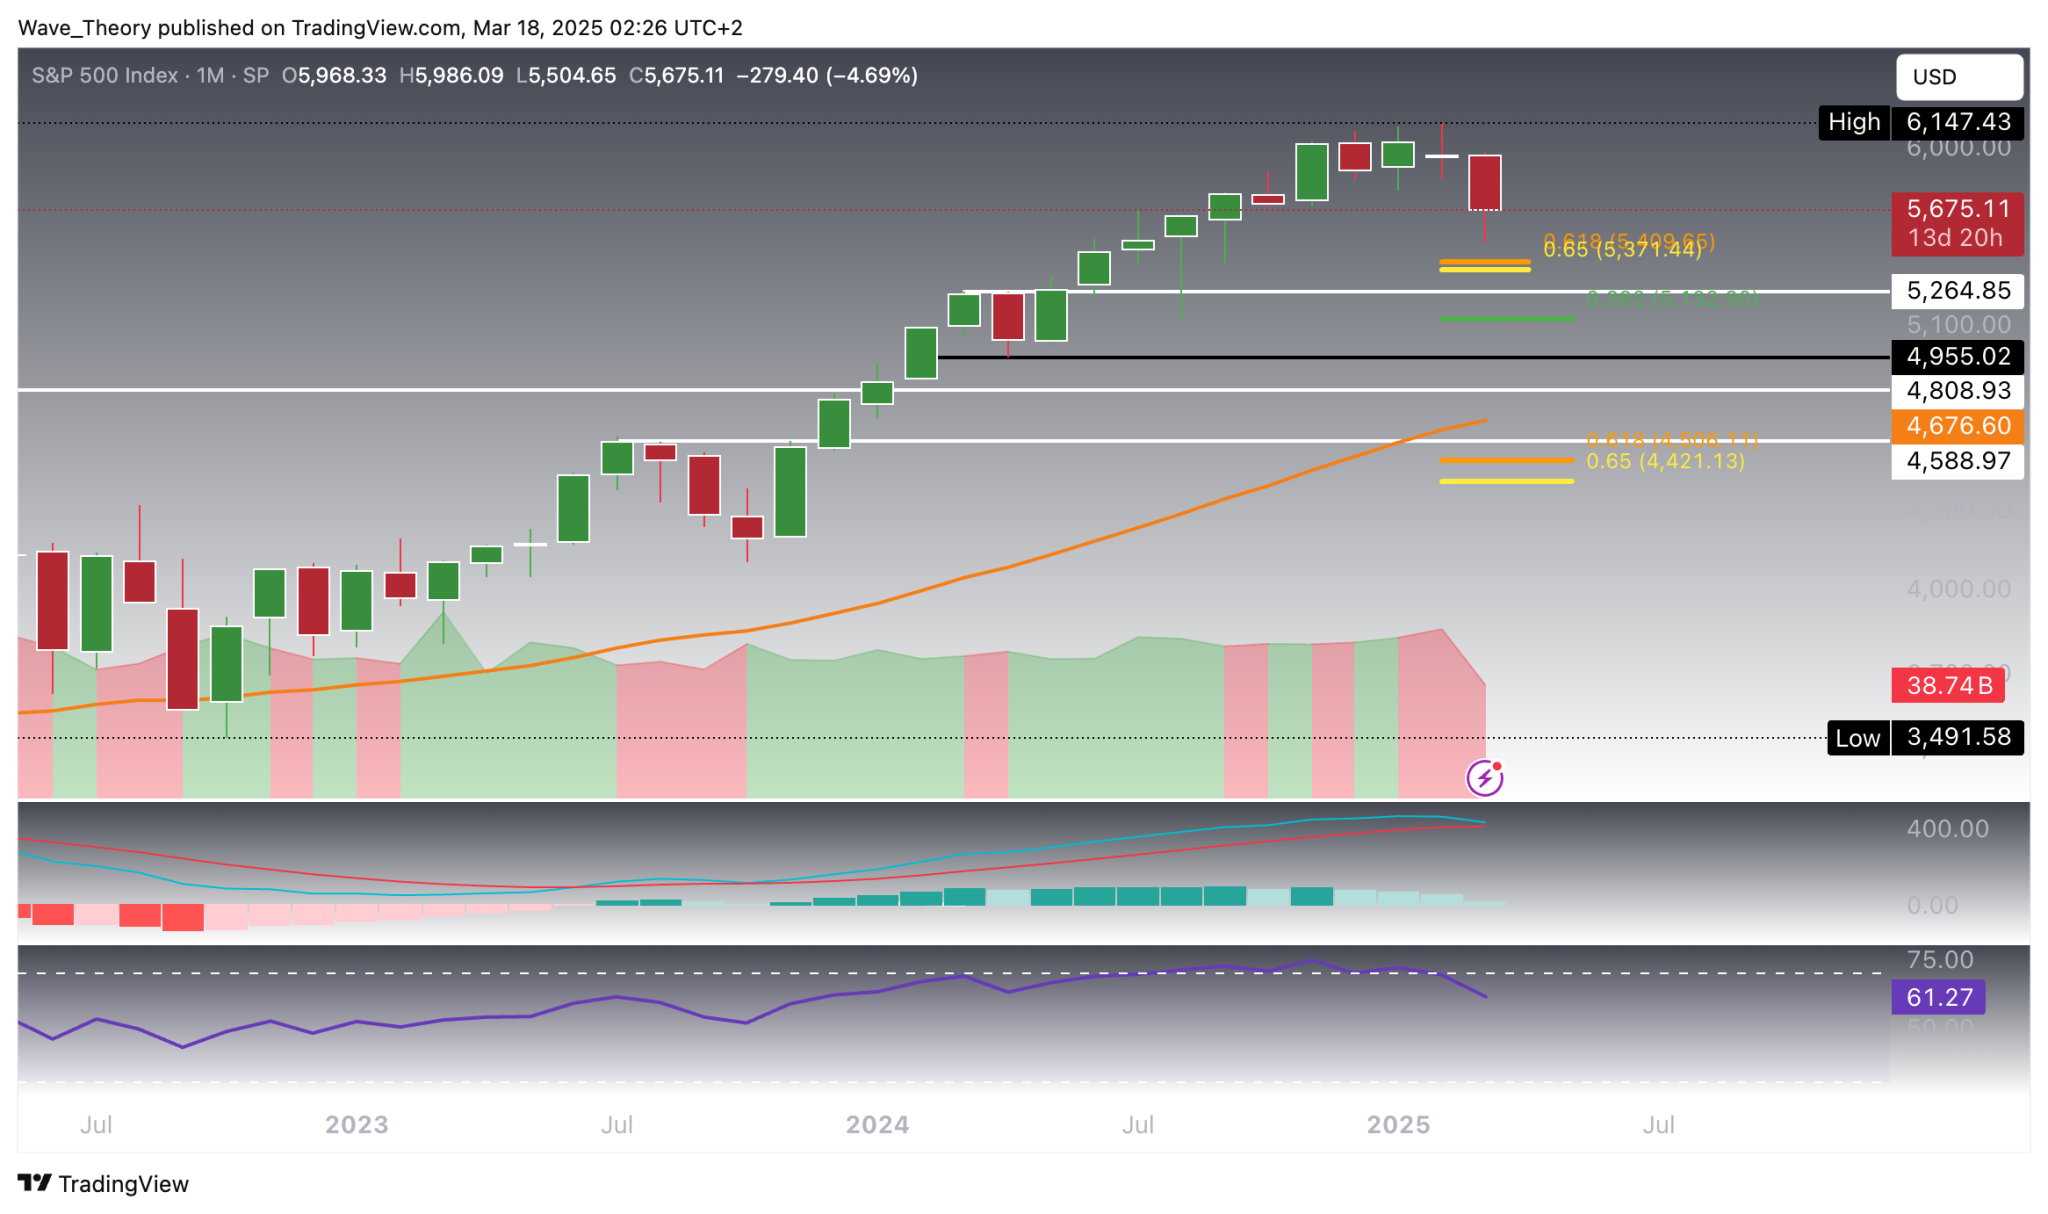
The S&P 500 (SPX) has declined by 10.5% from its recent highs over the past few weeks, approaching crucial Fibonacci support at 5,400. This juncture is pivotal, potentially setting the stage for a bullish reversal.
Key Points
The S&P 500 has corrected approximately 10.5% after hitting a high of 6,150. Over the past month, the MACD histogram has fallen consecutively, and the MACD lines are nearing a bearish cross. The RSI is shifting out of overbought status, moving toward a neutral zone. The index’s approach to the golden ratio support around 5,400 provides a possible bounce opportunity.
Summary
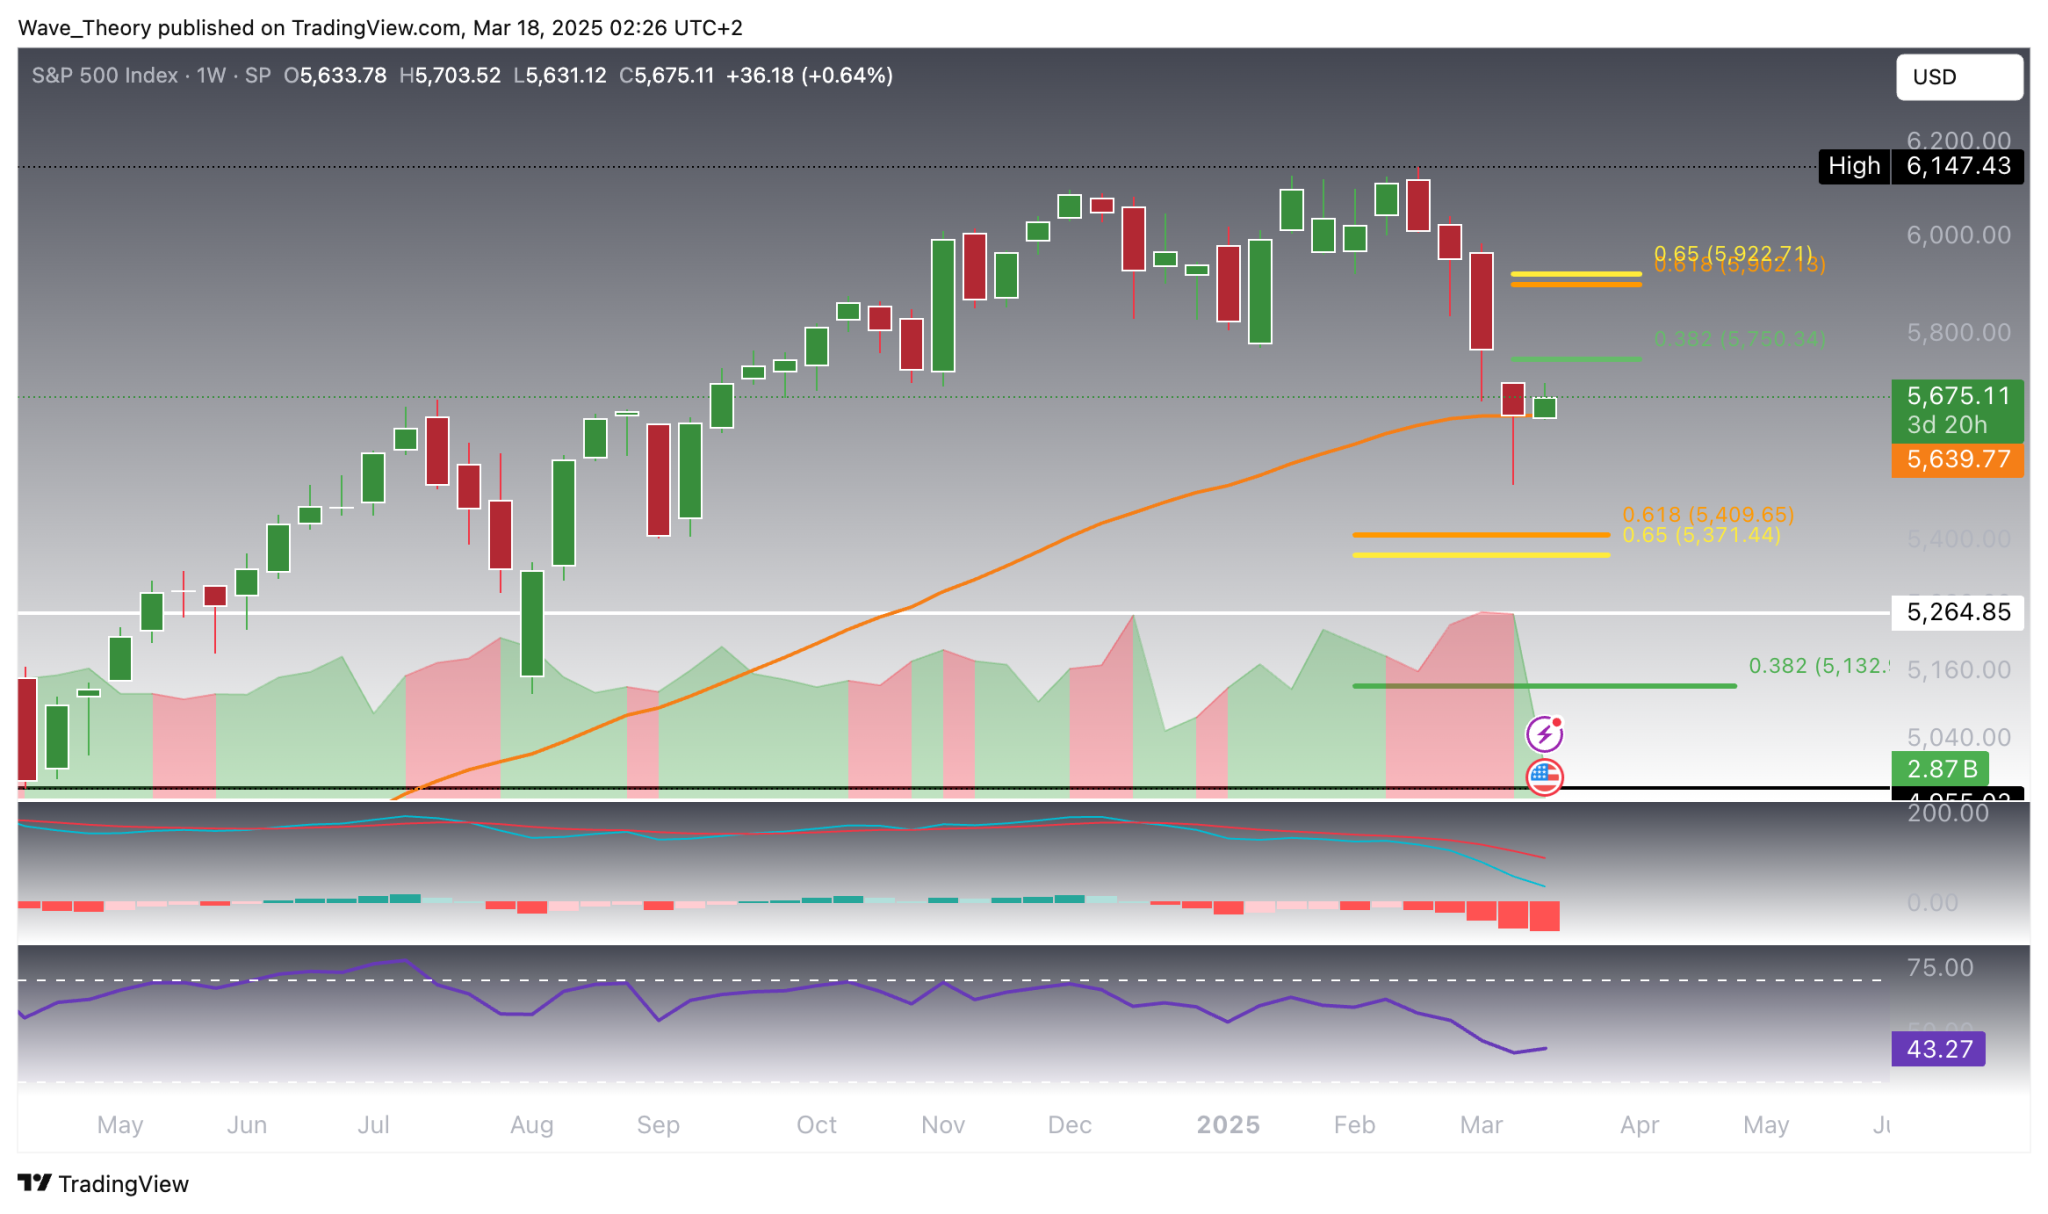
The SPX is testing substantial support at the 50-week EMA around 5,640. If this level holds, the index might target resistance points at 5,750 and potentially 5,920. Technical indicators are currently bearish, heightening the risk of further decline to the golden ratio support at 5,400.
Opinion & Analysis
“While there’s uncertainty in the indicators, the resilience of EMA crossings suggests medium-term bullish potential.”
Technical indicators on the daily chart support a bullish stance with a prevailing golden crossover, suggesting medium-term strength. However, critical resistance remains at 5,750 to potentially 5,920, which, if breached, could negate the current correction and drive SPX toward historic highs.
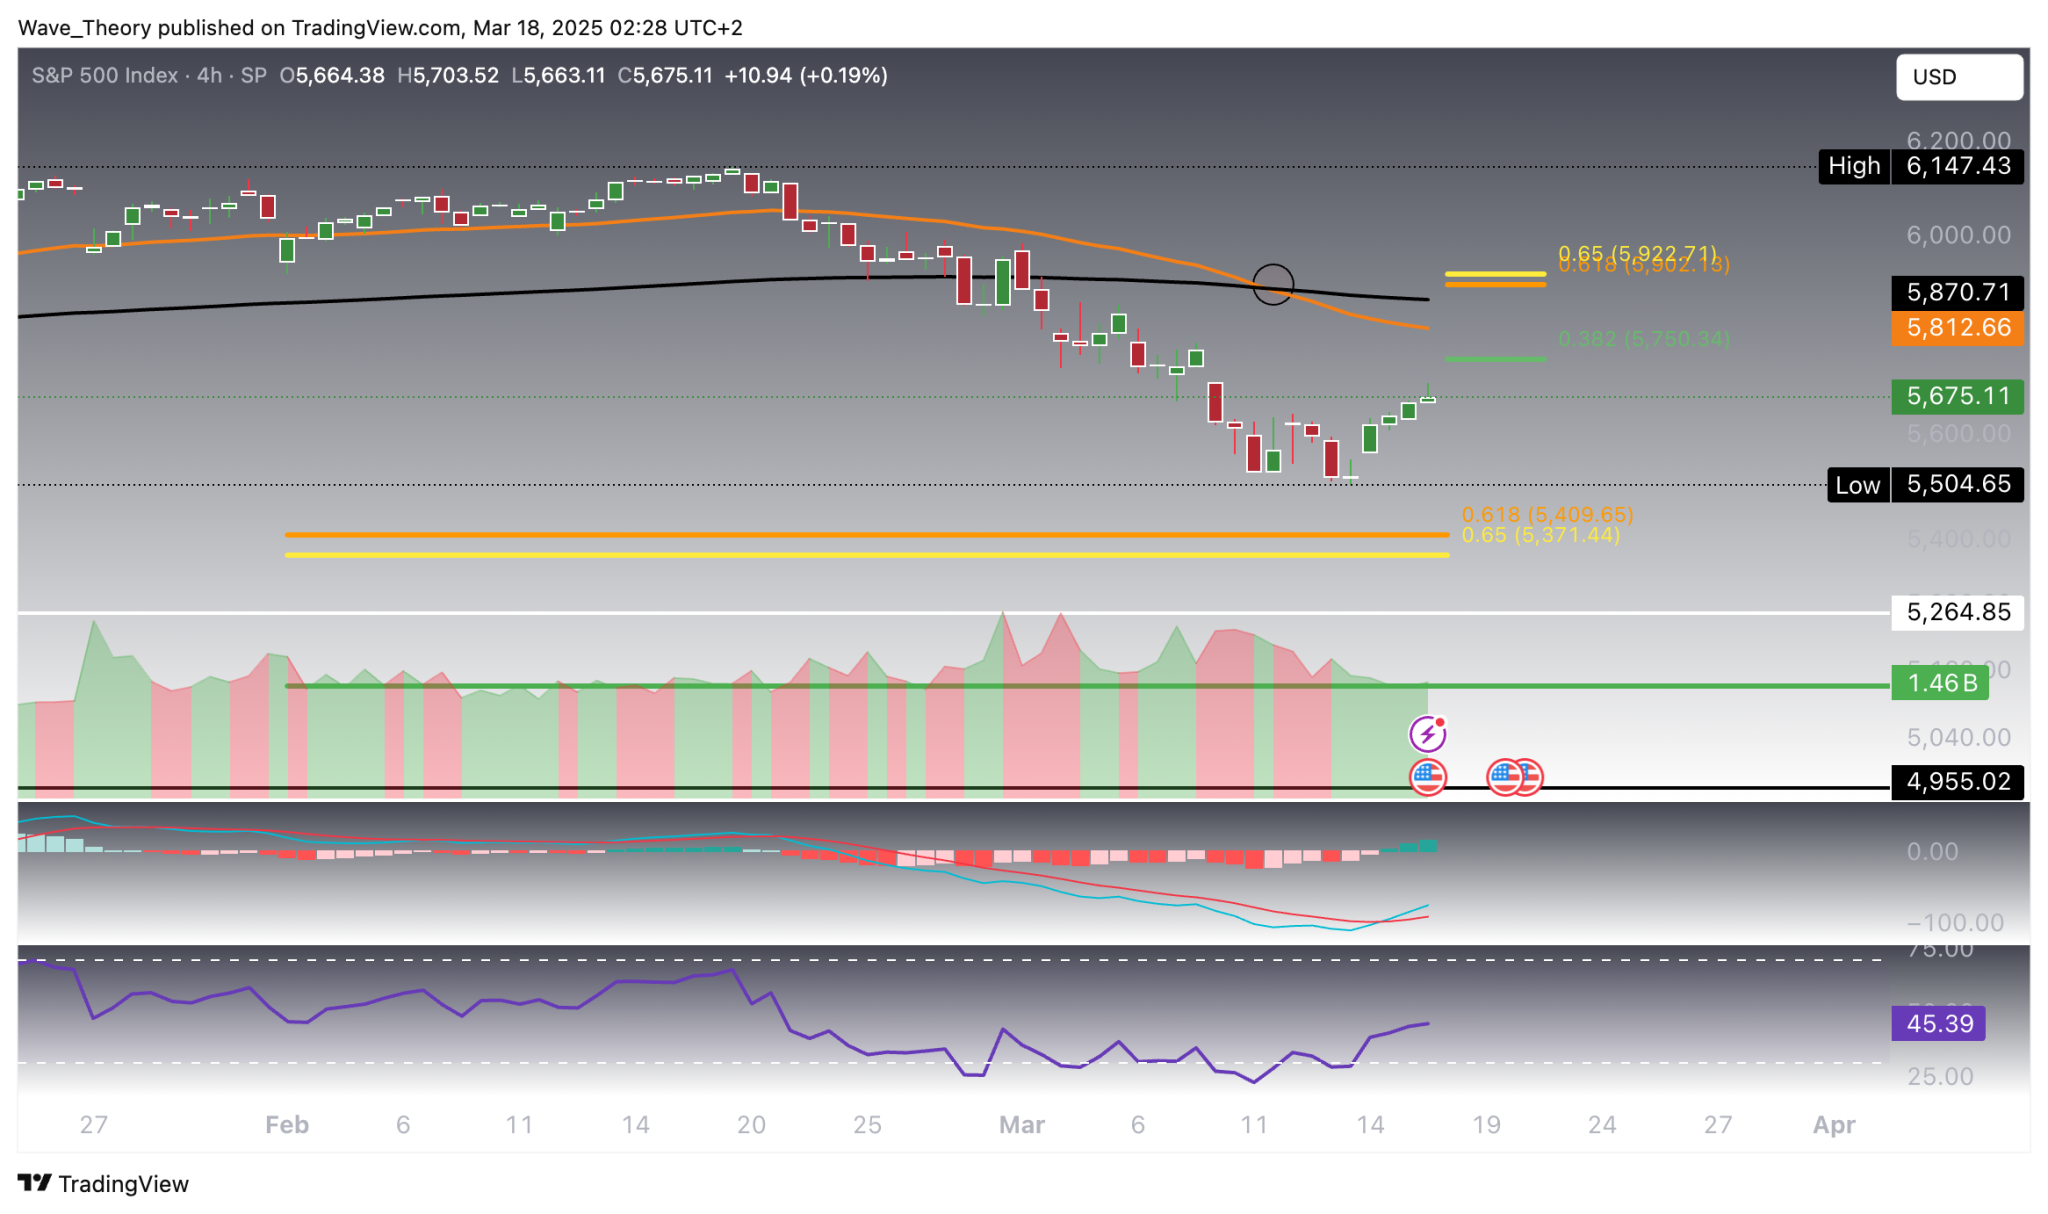
On the 4-hour chart, mixed signals manifest, with short-term bearish trends but slight bullish momentum. The MACD lines on this timeframe are bullishly crossed, yet the death cross remains an indicator of caution.
Check out our free forex signals and monitor the top economic events with FX Leaders economic calendar for better trading strategies.